Claude Custom Visuals Launch — AI Auto-Generates Interactive Charts and Diagrams
Anthropic Claude AI now auto-generates interactive charts, diagrams, and visualizations during conversations with its Custom Visuals feature in beta. Available on all plans including free.
Claude AI Custom Visuals has launched in beta. Tell Claude "Make an interactive periodic table" and a genuinely clickable periodic table appears right in the conversation. Click an element and details like atomic number, mass, and melting point unfold. This new AI visualization feature from Anthropic is available to all plan users, including free.

An interactive periodic table made by Claude. Clicking Silicon (Si) displays details: atomic number 14, mass 28.086u, melting point 1414°C.
AI Visualization — Explaining with Charts and Diagrams Instead of Text
Until now, AI chatbots explained everything in text only, no matter how complex. Ask about building load distribution and you'd get a wall of text. Request data analysis and numbers would be listed endlessly. Custom Visuals tackles this head-on. When Claude decides "this is better shown visually," it automatically inserts charts or diagrams into the conversation flow. No special commands needed — Claude decides on its own.
Types of Visualizations Claude Custom Visuals Can Create
Flowcharts — Visualize business processes and decision flows
Interactive Charts — Upload a CSV and get clickable, zoomable graphs
Concept Maps & System Diagrams — Organize complex structures at a glance
Comparison Tables — Compare products, services, or options side by side
Urban Planning & Architecture Analysis — Even specialized analysis like sunlight exposure and load distribution
The key is that these are not static images but interactive HTML content. Click buttons, move sliders, zoom into specific areas.
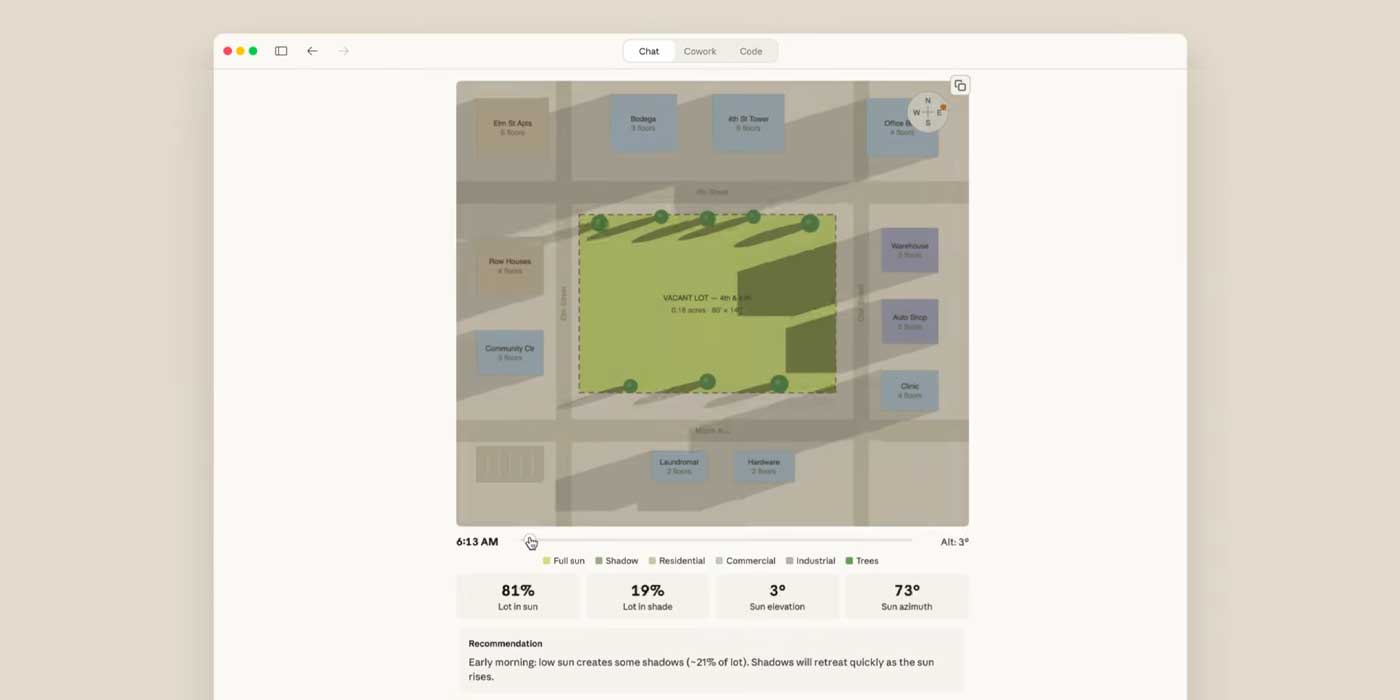
A sunlight analysis visualization by Claude. It shows how building shadows change throughout the day, with 81% of open space receiving sunlight and 19% in shade.
Artifacts vs Custom Visuals
Claude already had Artifacts — showing code or documents in a separate panel beside the chat. Custom Visuals is different: visualizations are embedded directly in the conversation flow. No need to switch to a separate panel. As the conversation continues, Claude can update visualizations in real-time. Say "highlight only 2024 data in this chart" and it modifies the same chart.
Available Plans and Saving Methods
Currently in beta, available on all Claude plans (Free, Pro, Max, Team, Enterprise). Only works on web and desktop apps — not yet on iOS/Android mobile apps.
Note that created visualizations are not saved by default. Three ways to preserve them:
For complex visualizations, the Claude Opus model produces the best results, according to Anthropic.
Use Cases — Reports, Learning, Brainstorming
Office workers — Upload Excel data and say "turn this into a presentation chart" for instant interactive charts. Create visual report materials in seconds.
Students — Just say "explain this visually." Beyond periodic tables, cell structures, historical timelines, and math concept visualizations are all possible.
PMs and designers — Instantly create project workflow flowcharts and user journey diagrams.
If you're new to AI, learn Claude basics first at the AI Fundamentals Learning Guide.
Try Claude Custom Visuals
Visit claude.ai and try it. For example:
Show US GDP growth from 2015 to 2025 as an interactive chartOr attach a CSV file and ask "visualize this data." Currently available on web (claude.ai) and desktop app.
To learn more about AI and vibe coding, check out our free learning guide.
Related Content — Get Started with AI | Free Learning Guide
Sources
Stay updated on AI news
Simple explanations of the latest AI developments