Execute Now
If you’re repeating the same Excel tasks every week, one prompt is all you need. Copy the prompt below and paste it into Claude Code.
Read sales_data.xlsx,
aggregate sales by department,
add SUM formulas to the summary table,
and save as result.xlsx.
Don't touch the original.
Prompt breakdown
This prompt contains all 3 formulas of a good prompt:
- Specify the file: "Read sales_data.xlsx"
- Describe the task: "aggregate sales by department, add SUM formulas"
- Specify the output: "save as result.xlsx"
It even adds "Don’t touch the original." A perfect prompt!
When you enter this prompt, Claude Code automatically writes and runs Python code. It reads the Excel file, analyzes it, aggregates it, and saves a new file—all on its own.
Check the Results
After entering the prompt, you’ll see output like this in the terminal.
📊 Starting Excel automation...

✅ sales_data.xlsx read successfully
  - Sheets: 1
  - Rows: 1,247
  - Columns: Date, Department, Product, Amount, Rep

🔍 Cleaning data...
  - 3 blank cells → filled with 0
  - Date formats unified

📈 Department aggregation results:
┌──────────────┬────────────┬──────────┐
│ Department   │ Total Sales│ Count    │
├──────────────┼────────────┼──────────┤
│ Sales Team 1 │ $452,000   │ 312      │
│ Sales Team 2 │ $387,000   │ 287      │
│ Marketing    │ $221,000   │ 198      │
│ Planning     │ $183,000   │ 156      │
│ Overseas     │ $315,000   │ 294      │
├──────────────┼────────────┼──────────┤
│ Total        │ $1,558,000 │ 1,247    │
└──────────────┴────────────┴──────────┘

✅ SUM/AVERAGE formulas inserted into summary table
💾 result.xlsx saved
📁 Original sales_data.xlsx → unchanged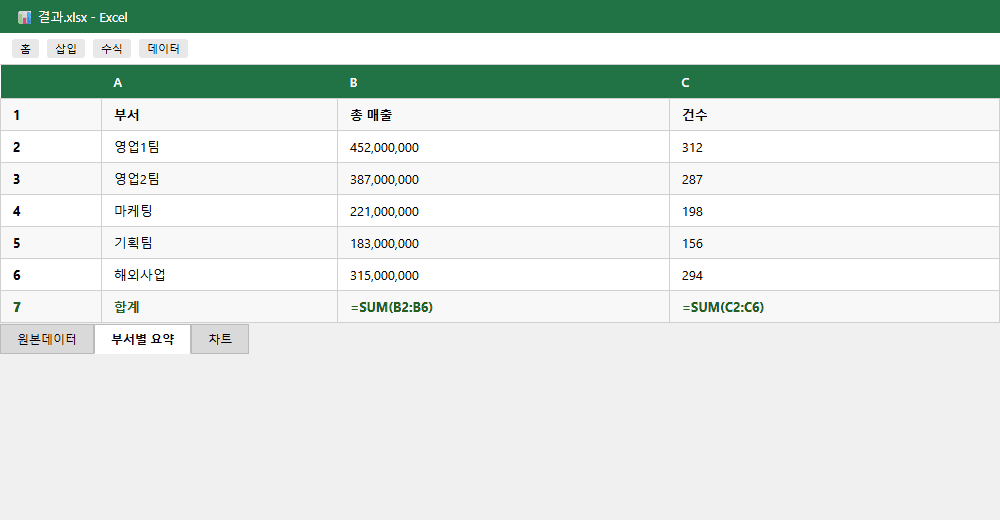
Doing it manually
30 min – 2 hours
Copying, sorting, formulas, formatting...
With Claude Code
1 prompt, 30 seconds
AI handles the rest
Understanding: What Claude Does
Your Excel just got organized with a single prompt, right? Let’s look at what Claude Code actually did behind the scenes.
Installs Python libraries & reads the file
Automatically installs openpyxl and pandas, then reads the Excel file. Analyzes all sheets even if there are multiple.
Cleans data & handles missing values
Automatically fixes blank cells, incorrect formats, and duplicate data. This is usually the most time-consuming part when done manually.
Creates pivot aggregation by department/month
Groups data by department and month, calculating totals, averages, etc. Same result as creating a pivot table yourself.
Inserts Excel formulas (SUM / AVERAGE)
Instead of just placing static values, it inserts actual Excel formulas (=SUM, =AVERAGE) into cells. Data changes will auto-recalculate.
Saves to new file (preserving original)
Saves results as 'result.xlsx'. The original file is never modified.
What are openpyxl and pandas?
These are Python libraries that Claude Code uses to process Excel files.openpyxl directly reads and writes .xlsx files, andpandas analyzes and transforms data. You don’t need to know about these libraries — Claude Code installs and uses them automatically.
Try It Yourself
Don’t worry if you don’t have a practice Excel file. Claude Code will create sample data for you. Just enter the prompt below as-is.
No Excel file needed
Don’t worry if you don’t have a practice Excel file. Tell Claude Code "Create sample sales data" and it will auto-generate a practice file. If you have a real work file, you can use that too.
Create a sample sales data Excel file.
Then aggregate by department,
create a summary table with SUM formulas,
and save as result.xlsx.
Preserve the original.
With this single prompt, Claude Code handles everything:
Verification Checklist
Have a real work file?
You can use your own actual Excel file instead of the sample. Put the file in your workspace folder and just change the filename in the prompt.
Example: "Read Feb_Sales.xlsx, aggregate by department, and create a summary table"
How to check the output file
Double-click result.xlsx in your workspace folder to open it in Excel (or Google Sheets). Click on a total cell in the summary sheet and you’ll see it contains an actual formula like =SUM(B2:B6) instead of just a static number.
You can also use Claude inside Excel
Claude Pro subscribers and above can use Claude directly inside Excel. Similar to Microsoft 365 Copilot, but with Claude’s powerful analysis capabilities right in your spreadsheet. Select cells and ask Claude for analysis without ever leaving Excel.
4 Excel Automation Tips
Here are useful tips for Excel work with Claude Code. These tips help you get more accurate and desired results.
Always specify to preserve the original
Always include "don’t touch the original" or"preserve the original" in your prompt. Claude Code preserves originals by default, but stating it explicitly makes it certain.
| Don't do this | Do this instead |
|---|---|
| "Clean up data.xlsx" | "Clean up data.xlsx and save as a new file. Preserve original." |
Explicitly say "use formulas"
By default, Claude Code puts calculated values (numbers) into cells. Saying "use formulas" makes it insert actual Excel formulas (=SUM, =AVERAGE, etc.). If the source data changes later, values auto-recalculate.
| Result | Prompt difference |
|---|---|
| Cell shows 1,500,000 (static value) | "Calculate the total" |
| Cell shows =SUM(B2:B10) (formula) | "Add the total as a SUM formula" |
Be specific about chart types
Saying just "make a chart" lets Claude pick something appropriate. But if you have a specific chart in mind, be explicit.
Bar chart
Good for comparisons
Line chart
Good for trends
Pie chart
Good for proportions
Combo chart
Mixed comparisons
Example: "Create a bar chart of sales by department"
Process multiple files at once
Have multiple Excel files? Use the "all xlsx files in the folder" pattern. Claude Code reads and processes all Excel files in the folder at once.
Read all xlsx files in the data folder,
merge them into one,
create a department summary table,
and save as consolidated-report.xlsx.
You can do these too — application ideas
Excel automation isn’t limited to sales aggregation. These types of tasks can be automated the same way:
- Auto-generate weekly reports — Compile this week’s data into a report template
- Meeting notes organization — Read meeting notes and organize into action items in Excel
- Sales analysis dashboard — Analyze sales data and generate an HTML report with charts
- Project status tracking — Consolidate progress from multiple sheets into a single status table
Common thread: one prompt does it all. The key is clearly stating "what," "how," and "where to save."
Claude Code subscription info
This exercise requires a Claude subscription. No API key needed—just subscribe at claude.ai and you’re ready to go.
We recommend Claude Max ($100/mo). For repetitive Claude Code tasks like Excel automation, you need generous usage allowance. Starting with Pro ($20/mo) and upgrading if usage feels tight is also a good approach.
2 hours of weekly Excel work → 1 prompt, 30 seconds
No coding experience needed, no Excel expertise required—Claude Code handles it for you.